Back in August, FABB encouraged riders and others to participate in a Northern Virginia Transportation Authority (NVTA) survey of regional transportation to let policy makers and planners know our transportation priorities. We asked respondents to add comments seeking the prioritization of low-cost solutions involving ped/bike infrastructure and safety design measures rather than massive highway expansion projects. We also asked for people to express support for making public health and climate change mitigation the top planning considerations for all projects.
The survey results are now in and are available in an NVTA presentation here.
- Among all respondents, the priority most frequently ranked 1st, was “more transit, walking, biking options.”
- The 2nd and 3rd most commonly selected priorities were “improve travel time predictability” and “reduce traffic congestion.”
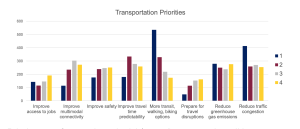
The results unsurprisingly showed some differences in priorities between citizens living in inner and outer jurisdictions.
- When broken down by location, survey respondents from inner jurisdictions selected “more transit, walking, biking options” as the top priority while those from outer jurisdictions chose “reduce traffic congestion.”
- The good news for everyone is that more biking, walking, and transit options contribute markedly to reduced traffic congestion while bike commuters have long known that travel time predictability is a major benefit of riding a bike to work.
The survey asked respondents to allocate hypothetical investment dollars in transportation. Most seemed to recognize that roadway and rail improvements were the most expensive options and gave them the highest allocation with rail edging out roadways.
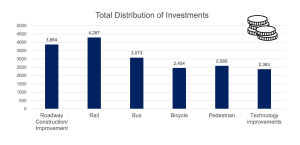
- More important, respondents allocated biking and walking 27 percent of the total hypothetical allocation, which easily topped the just under 21 percent given to road improvements.
- Historically, biking, pedestrian, and shared-use projects have received around 1 percent of federal and state transportation funding (much less in many states).
- We recognize that 27 percent of the billions spent on transportation infrastructure each year is clearly above the needed funding for even a Dutch-level of bicycling infrastructure. But such strong support must be seen by NVTA and other transportation planners as an expression of public support for more bike and pedestrian spending, doubling, tripling, or even quadrupling the current amount allocated.
Thanks to everyone who took the time to respond to the survey.